The universe is changing at a supersonic speed, and most enterprises are not left behind where they are needed to adapt to the ever-changing business environment. Failure to adapt equals extinction. Digital transformation is one front that is a powerful driver for most businesses today. Most businesses must shift their legacy from normal analog models to digital platforms. When you look back at the era of vinyl records and having to fill forms with pen and paper and consider the current world, you realize that most of these concepts have become digital. The modern digital business comes with apps containing microservices, distributed services, and containers that run within the cloud infrastructure.
Businesses must keep pace by being vibrant and developing scalable and dynamic app development tactics to ensure they maintain a competitive advantage. Microservices are the solution to contain such a competitive environment since they allow businesses to quickly adjust their software as they maintain their reliability and visibility. The shift towards microservices architectures has revolutionized how applications are built, deployed, and scaled.
Microservices have a unique approach where they divide single apps into an array of small, independent services. Each service runs its own process and communicates using lightweight mechanisms. The interesting part is how they bring about unparalleled flexibility and efficiency. You need to realize that great power comes along with great responsibility. The distributed nature of the microservices brings a new headache in terms of complexity (especially for monitoring and comprehending the system’s state). This is a challenge forcing us to discuss observability. In cloud computing and IT, observability is an array of processes and related tools helping you collect, aggregate, and correlate real-time data for clear analysis of what’s going on and have better results in terms of service delivery.
A brief on observability
Observability helps companies achieve improved performance, cost efficiency, and more optimization. DevOps teams within the cloud environments embrace observability as a tool for debugging applications and diagnosing root causes of system problems or unknown issues in some microservice components. Developers can identify all events within a production environment, helping them shorten delivery cycles, optimize performance, and prevent or avoid any downtime.
Observability, derived from control theory, has become a foundation for effective microservices management. It goes beyond traditional monitoring and offers insights into the internal states of different systems through the external outputs they produce. Observability facilitates resilience, reliability, and performance for microservices, allowing teams to detect and diagnose issues early enough before becoming catastrophic failures. There are different observability design patterns for implementation in microservices and we will discuss them in this article.
What Are Microservices?
Microservices architecture represents a paradigm shift in how apps are structured, evolving from the traditional monolithic design to a more decentralized model. The approach segments an app into a collection of small, self-contained services, each tailored to execute a specific business function. The services are loosely coupled and independently deployable, allowing unparalleled agility and modularity in application development and maintenance.
The strength of microservices is in simplifying large, complex applications into manageable units. Each microservice operates autonomously, developed, tested, and deployed without relying on the broader application framework. The breakdown into smaller and more manageable pieces enhances the app’s flexibility & scalability. It aligns perfectly with the principles of DevOps by supporting independent deployments and continuous integration and delivery workflows.
Applications in a microservices architecture, components, or services are independent and communicate with each other using defined protocols and APIs. This is a good model facilitating the usage of different programming languages and technologies to achieve various services to meet the set requirements.
Also read: Microservices vs Monolithic
Benefits of Microservices
The DevOps landscape has experienced some game-changing features with the introduction of microservices architecture. Here are some advantages to enjoy:
- Independent Deployments: Microservices enable isolated updates or modifications to services without necessitating a comprehensive redeployment of the entire app. Developers can dynamically make adjustments, update, or rewrite an entire service without disrupting other app functions. The process enables the implementation of DevOps’s continuous delivery and deployment philosophy.
- Fault Isolation: When considering monolithic architectures, any single point of disaster can crash the entire system. Microservices act differently and are separate from one another. If one service encounters an issue, it doesn’t necessarily impair the entire app’s functionality. This significantly improves the general resilience and stability of the system.
- Scalable Efficiency: You can scale microservices independently, allowing specific components of an application to be scaled in response to demand variations. If demand for a specific function increases, you scale up that service instead of the entire app. The targeted approach in scaling enhances operational efficiency and is more cost-effective than scaling an entire monolithic application. Most organizations facing variable loads will go for microservices as a viable choice.
Role of Design Patterns in Microservices
In the microservices space, one size fits all is not applicable. The demands and requirements from one application differ from those of the next app. The adoption of specific design patterns comes into play for tailoring architecture to the unique demands of each application. These patterns address various challenges integral in microservices, including scalability, complexity management, and distributed data handling.
- Facilitating Scalability: Design patterns such as replicated service instances and sharding are instrumental in ensuring services are efficiently duplicated and distributed. The end goal is to enhance the system’s ability to scale.
- Simplifying Complexity: Design patterns help reduce the complexity that comes with adopting microservices architecture. The transition to a microservices architecture can introduce an explosion of services that can be overwhelming to manage. Appropriate patterns like the API gateway or aggregator can streamline service management and facilitate smoother communication or service interactions.
- Managing Distributed Data: Each microservice typically operates its own database, necessitating sophisticated transaction management strategies and data consistency. Patterns like the saga or event sourcing offer robust solutions for managing distributed data complexities.
- Optimizing Communication: Effective communication between microservices is a core system functionality element. Inter-service communications happen through APIs, which becomes complicated with increased services. Design patterns like the client-side load balancer and circuit breaker help ensure reliable and efficient inter-service communication.
Observability vs. Monitoring
You may happen to meet the two terms being used interchangeably. Observability and monitoring are two unique concepts with different focuses in system management. Monitoring targets the collection of predefined metrics and logs to track the system’s state and alert for known issues. It is a reactive approach that fully relies on anticipating problems and setting up mechanisms to detect them. On the other hand, observability is a more proactive and comprehensive strategy. It allows for an in-depth understanding of the system’s internal state from the outside, allowing the DevOps teams to diagnose unforeseen issues based on the output data. Observability gives the insights required to ask arbitrary questions about the system’s behavior without having advanced knowledge of what to look for.
The Core Pillars of Observability
Achieving the concept of observability relies on three core pillars (or data classes): logs, metrics, and traces. Each is important in providing a holistic view of the microservices architecture. They include:
Logs – We define a log as an immutable written record for particular events, giving details on what happened and when. They are timestamped records for events occurring within an app. You will get details about the timestamps and payloads and analyze them to help debug issues. They provide a granular, event-by-event narrative for all operations within a system. Centralized logging helps to correlate events across services. We have three types of logs: binary, structured, and plaintext. Whenever an issue occurs in a system, the first go-to resource as a point of reference is the logs.
Metrics – A metric is defined as a numerical representation of data tracked over time intervals. They provide a high-level overview of the system’s health/state, performance, and usage patterns. Metrics like response time, names, timestamps, error rates, KPIs, and resource utilization are critical in providing context for proactive monitoring and scaling decisions. Metrics have a default structure, and you can easily carry out their optimization for storage. They allow for simple querying, and analysts can trace changes related to a particular element with time.
Traces – Traces follow the journey of a given request while traveling through the microservices space or the distributed system. The mapped journey offers insights concerning the flow and interaction happening between services. Distributed tracing helps understand the service chains’ latency, failures, and bottlenecks, allowing developers to analyze root causes and optimization features.
Tools and Technologies
There are various tools and technologies supporting observability in microservices architectures. Each brings a unique design for capturing and analyzing logs, metrics, and traces. Let us discuss some of them.
- Prometheus: This is an open-source monitoring and alerting toolkit. It has unique abilities to collect and query metrics. Good for monitoring microservices, it has a dynamic service discovery and scalable data model.
- Grafana: It is an open-source multi-platform for analytics and monitoring. A powerful tool for visualizing metrics, enabling teams to create dashboards that give real-time insights into the performance of a given system. You can use it with Prometheus to comprehensively view the metrics collected across microservices.
- Jaeger: Jaeger is a distributed tracing system enabling fine-grained visibility into the performance of microservices. Developers can easily trace the flow of requests through the system, pinpoint latency issues, and understand how services interact.
- Elastic Stack (ELK): It comprises Elasticsearch, Logstash, and Kibana. The Elastic Stack is a great suite for searching, analyzing, and visualizing real-time log data. You can use it for centralized logging in microservices environments to get deep insights into system events and behaviors.
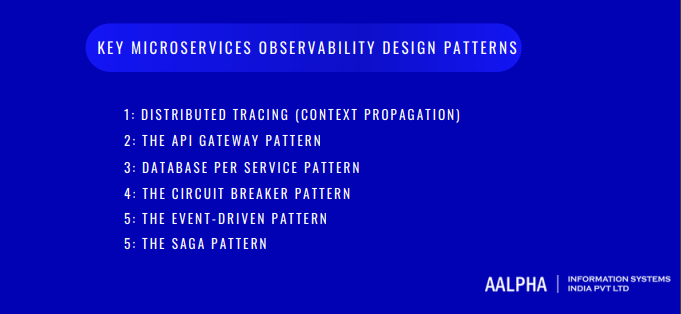
Key Microservices Observability Design Patterns
You need to use different strategic approaches to achieve observability in microservices. Observability design patterns help address specific challenges and streamline the process of monitoring and understanding the microservices architectures. Let us explore some of the key design patterns:
-
Distributed Tracing (Context Propagation)
This pattern offers insights to understand the operations of an app across multiple connected devices. The major aim of this pattern is to facilitate the challenge of identifying the root cause of failures or bottlenecks within a system where requests are traveling across multiple services. The pattern will offer a detailed path for the particular request across services. The distributed tracer records all the information regarding the service calls made in the request processing, showing the various services involved, the interactions between the services, and the time each service takes to handle external requests.
The pattern involves tagging each external request with a unique ID as it joins the microservices network. Each service the request passes through logs this identifier, allowing the entire path of the request to be reconstructed. The logs are tracked to a central server, giving deep visibility to understand the request flows and helping in fault diagnosis and performance optimization.
-
The API Gateway Pattern
The microservices architecture has every service displaying an array of fine-grained APIs. Managing such APIs independently is a complex task when you have lots of microservices. The API Gateway pattern solves this by acting as a single entry point to all client requests. The requests are redirected to the right microservice, and whatever response comes out from various services is aggregated into a cohesive reply to the client.
Beyond simplifying requests and responses, the API Gateway enriches the architecture with vital functionalities such as monitoring, authentication, and rate limiting, seamlessly handling these cross-cutting concerns. Moreover, it presents clients with a singular, consolidated API, significantly easing the consumption process and abstracting the underlying complexity of the microservices architecture.
-
Database Per Service Pattern
This pattern solves the challenge of scaling and maintaining an application brought about by issues of tight coupling between modules sharing a single database. Each microservice has its own database, which brings about high cohesion and loose coupling. Every microservice has its unique database well suited for their needs and allows for independent scaling.
You need to address the issues related to distributed data management for this pattern. You need to understand how to implement data consistency across services.
-
The Circuit Breaker Pattern
You will realize that services depend on one another in a microservices architecture. In case of any failure or breakdown in any of them, dependent services become affected. The Circuit Breaker pattern solves this. It prevents cascading failures in interconnected microservices. Circuit breakers monitor service interactions and automatically prevent calls to any detected unhealthy services. When a service fails to respond successfully within a predefined threshold, the circuit breaker trips and further calls to the service are blocked until it recovers. This state change is logged for observability. Once stability is confirmed, the circuit breaker resets, allowing traffic to resume. This pattern plays a vital role in maintaining system resilience and performance, albeit necessitating precise adjustment to ensure an optimal balance between responsiveness and failure detection.
-
The Event-Driven Pattern
Data consistency can be difficult to maintain in dynamic microservices environments. Event-driven observability solves this by pushing notifications or changes of significant events as they occur.
This pattern involves services releasing events or signals in response to specific triggers, which are then captured by the observability infrastructure. This real-time data flow enables immediate awareness and response. Each service maintains consistency and may not require synchronous communication (enables asynchronous communication).
-
The Saga Pattern
There is always the challenge of handling multiple business transactions. A saga pattern is the solution here. We describe a saga as a sequence of local transactions, and each updates data in a given service. If one of the transactions breaks down, the saga will execute a compensating transaction that aims to undo the failed transactions’ effects.
Microservices Observability Challenges and Strategies to Resolve
Observability within a microservices architecture faces some distinct challenges. Some challenges include identifying distributed errors, managing large volumes of data, and ensuring system reliability amidst increased latency.
- Distributed Errors Diagnosis. In a complex ecosystem of microservices, tracing requests and data through multiple micro-applications complicates the process of debugging and identifying errors. Developers use tracing technologies like Zipkin to facilitate the monitoring of request flows, pinpoint bottlenecks, and improve delivery efficiency.
- Managing Large Data Volumes. The sheer volume of logs, metrics, and traces generated in a microservices observability framework can be overwhelming. It becomes obscure to manage and generate insights. You need to leverage orchestration platforms to streamline handling large data sets. Such platforms are good in the automated management of microservices deployments, including scaling operations and data processing, thus reducing potential bottlenecks.
- Latency and System Reliability Issues. Transitioning to microservices can introduce latency and reliability concerns. The cumulative effect of delays across the services can impact the overall system performance. To solve this, set a software intelligence platform that will automatically detect system components and their interactions. With such, you can detect any malfunctioning elements and latency issues early enough. The end result is the implementation of prompt remediation and maintenance of system integrity.
Conclusion
You need observability patterns to manage and monitor microservices architecture. We have seen the different patterns that one can use. Such patterns help a team identify and resolve any problems, use resources better, and enhance service-level agreements. Implementing the patterns successfully ensures your microservices architecture is scalable, performant and reliable.
Any queries? Connect with our microservices consulting company : Aalpha information systems!





Share This Article:
Written by:
Stuti Dhruv
Stuti Dhruv is a Senior Consultant at Aalpha Information Systems, specializing in pre-sales and advising clients on the latest technology trends. With years of experience in the IT industry, she helps businesses harness the power of technology for growth and success.
Stuti Dhruv is a Senior Consultant at Aalpha Information Systems, specializing in pre-sales and advising clients on the latest technology trends. With years of experience in the IT industry, she helps businesses harness the power of technology for growth and success.